Beyond oil: How the Middle East conflict ripples from fertilizer, to food, all the way to forex
-
 Web Desk
-
Web Desk
-
- Published July 13, 2026

Market analysis written by Inki Cho, Senior Financial Markets Strategist at Exness.
When markets priced in the consequences of the conflict in the Middle East, oil dominated the conversation. The Strait of Hormuz, however, carries far more than crude oil, and a narrow lens on energy misses the broader macro picture forming around the chokepoint.
The Strait is also one of the largest transit corridors for nitrogen-based fertilizers and the natural gas feedstock that produces them. The transmission from fertilizer cargoes to food inflation, and from food inflation to the DXY, is where the real macro story is hiding for retail and macro-focused traders.
The chokepoint beyond crude
The Strait of Hormuz carries roughly 20% to 30% of global fertilizer trade, including about 35% of global urea exports, and around 20% of seaborne LNG, the primary feedstock for nitrogen-based fertilizers. That places urea and ammonia in the same risk category as crude oil, though they receive a fraction of the market attention.
Saudi Arabia, Qatar, Iran, Bahrain, and Oman are the primary exporters routed through the Strait, with Saudi Arabia alone accounting for roughly 16% of global ammonia exports. Together, the five Hormuz-dependent Gulf states supply between 8% and 10% of global fertilizer exports, equivalent to roughly 13.5 billion USD in trade flows across 43 importing countries.
Since the conflict escalated in late February, traffic through the Strait has fallen by more than 95% from pre-crisis levels, and regional urea production has dropped by 55% to 60%.
From fertilizer cargoes to food inflation
Nitrogen-intensive crops are the first to feel the squeeze. Wheat, corn, and rice all depend heavily on urea and ammonia inputs, and any shortfall pushes farmers toward reduced application or smaller planted acreage. The result is a delayed compression of yields in the next harvest cycle, which surfaces in commodity prices before it reaches consumers.
The numbers are already moving. The World Bank reported urea prices climbing roughly 46% month-on-month between February and March 2026, with some benchmarks reaching about 700 USD per metric ton. Benchmark Egyptian granular urea also rose over the same period, from around 400 USD to 490 USD per metric ton. Wheat prices were up 13%, and the global cereal price index rose by 7%.
Yara, one of the largest fertilizer companies globally, has cited urea price increases of 60% to 70% since the crisis began, with African importers most exposed. These shocks map directly onto the planting calendars of major food importers across Asia, Africa, and Latin America.
Where the food shock lands hardest
Roughly one-third of the global fertilizer trade has been disrupted, and the regions least able to absorb that shock are the most import-dependent. South Asia stands out as the most exposed cluster, with India sourcing about 20% of its fertilizer from the Gulf and Pakistan relying almost entirely on Qatari and Emirati LNG to produce nitrogen at home.
Sub-Saharan Africa and parts of North Africa carry similar vulnerabilities, with more than 90% of fertilizer in many of these markets being imported. According to the International Monetary Fund, food accounts for roughly 36% of household spending in low-income economies, compared to about 9% in advanced economies, which is why even moderate input shocks translate into outsized inflation prints.
The macro consequence is a familiar one. As food inflation climbs, central banks face the dilemma of tightening into weakening growth, current accounts deteriorate as import bills swell, and confidence in local currencies erodes. Egypt, Bangladesh, Pakistan, Nigeria, and Sri Lanka stand out as the most exposed, combining high food import ratios with limited fiscal buffers.
“The market is reading this as an oil story, but the fertilizer leg of the disruption is the one that compounds over multiple harvest cycles,” says Michael Stark, Financial Content Lead at Exness. “By the time the second-order effects reach emerging market data, the repricing tends to happen quickly and not in favor of those currencies.”
From fields to the DXY
This is where the analytical chain reconnects with the foreign exchange market. When food inflation accelerates in emerging markets that depend on imported staples, three forces converge on the dollar. Capital rotates toward USD-denominated assets, current account deficits widen, and central bank credibility comes under pressure as policy responses lag the price shock.
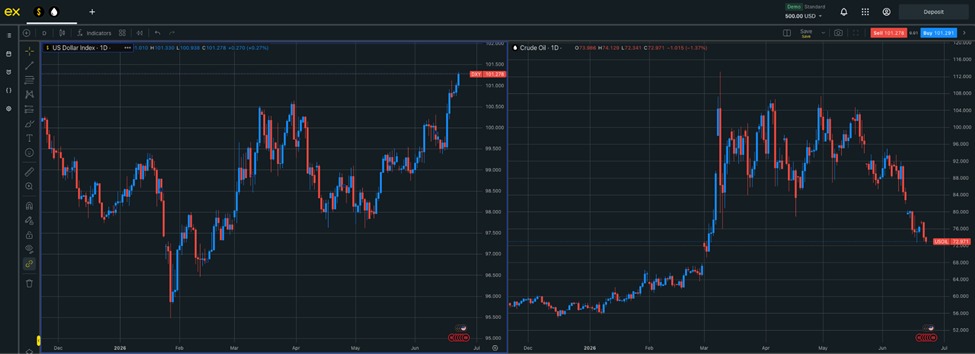
Split-view chart powered by the Exness Terminal.
The historical pattern is consistent. During the 2007-2008 commodity-led food shock, the FAO Food Price Index rose by roughly 57%, and the dollar saw bouts of safe-haven strength as import-dependent economies absorbed the damage. The 2010-2011 cycle followed a similar arc, with a 40% spike in food prices fueling political instability across MENA and renewed flight-to-quality flows into USD assets.
The current setup mirrors that template. US CPI rose to 3.8% in April 2026, and the Dollar Index held between 98 and 99 as markets priced out further Federal Reserve cuts. If food inflation accelerates through the second half of the year, as the FAO has warned, the DXY becomes the cleanest expression of that pressure, particularly through pairs such as USDINR, USDEGP, USDPKR, and USDZAR.
As Stark notes, “In an environment where supply shocks are layered rather than isolated, the dollar tends to benefit twice. First, as the funding currency because emerging markets need to import food and energy, and then as the safe haven absorbing the capital fleeing those same economies when inflation prints break higher.”
What traders should watch
For traders positioning around this dynamic, the early signals sit at the intersection of commodity, shipping, and central bank data. Keeping an eye on oil alone could lead traders to look past the slower-moving repricing in food and currency markets, which historically arrives in lagged but concentrated bursts. Here’s what to watch:
● Urea, ammonia, and DAP benchmark prices, with Egyptian granular urea as the most-tracked nitrogen reference.
● Shipping and tanker data out of the Persian Gulf, including transit counts through the Strait and laden-vessel inventory.
● World Bank and FAO food commodity indexes, particularly the cereal and grain sub-indexes.
● Central bank statements from India, Pakistan, Egypt, and Nigeria, where food-driven CPI prints can force off-cycle policy moves.
● DXY behavior against emerging market currencies after EM CPI releases, where the reaction function often signals the next leg.
Within foreign exchange, the cleanest expressions of this thesis are seen in currency pairs with the dollar against import-heavy emerging market currencies, gold, and the broader DXY. Crude remains relevant, but it captures only one channel of a multi-channel shock.
Where execution meets a multi-channel shock
When near-term supply is shaped by political and logistical access rather than production capacity, traders relying on traditional supply-and-demand models risk being caught off guard. Access conditions can shift quickly, and oil and food-linked currency pairs may reprice in short, uneven bursts, leaving little room between identifying a move and acting on it.
Understanding the move is one thing, and acting on it under real market conditions is another. Geopolitical signals make execution consistency a core element of risk control for crude, and the same logic applies to gold, commodity-linked currencies, and emerging-market crosses that react to the same triggers.
This is where Exness enters the discussion. When faced with multi-channel shocks, CFD traders are not only watching crude. They may also be tracking gold, the DXY, commodity-linked currencies, and emerging market pairs as the same supply story ripples across asset classes. When several markets are repricing at once, execution consistency and spread stability become part of how a trader manages risk. An accurate macro read can still lose value if the trading environment adds unnecessary friction at the point of entry or exit.
Exness Terminal contributes to this workflow. CFD traders following a shock that moves from oil to food inflation and then into currencies need a clear way to monitor related instruments, compare price action, place trades, and manage open exposure without moving between disconnected tools. With charting, trading, position management, and account controls all within a single web and mobile environment, Exness Terminal supports a more controlled path from analysis to action as market conditions change rapidly.
The broader point is that supply shocks do not remain confined to a single market. They travel through commodities, inflation expectations, central bank policy, and FX. For CFD traders, the challenge is not only identifying that chain early. It is creating a trading environment that helps them respond with discipline when the chain starts moving.
Web Desk
Hamariweb.com Webdesk is where to get the latest news feeds on current affairs, cultural activities, and current news in Pakistan and other parts of the world. Our team is led by a sharp editorial mind and accuracy and works to make the reader feel updated and motivated with journalistic accuracy and the power of the story. Everyday news, headline news, news stories, breaking news, major news, minor news, we have the heartbeat of the nation on your screen--always relevant and with links.




Leave a Reply